Find where your hospital is losing revenue, stock and time
Power BI dashboards and data reviews for private hospitals, clinics and billing teams. Built by a hospital administrator with 12+ years running departments, stores and support services, so the dashboards answer the questions your managers actually ask.
Fixed-fee starter report, quoted before any work begins.
What I build for hospital teams
Four dashboards cover the questions administrators ask most. Each one starts from the exports you already have.
Revenue leakage and collections
Collection efficiency by payer and service, denial rates, write-offs and outstanding balances, so you can see where money stalls and who to chase.
Inventory and expiry risk
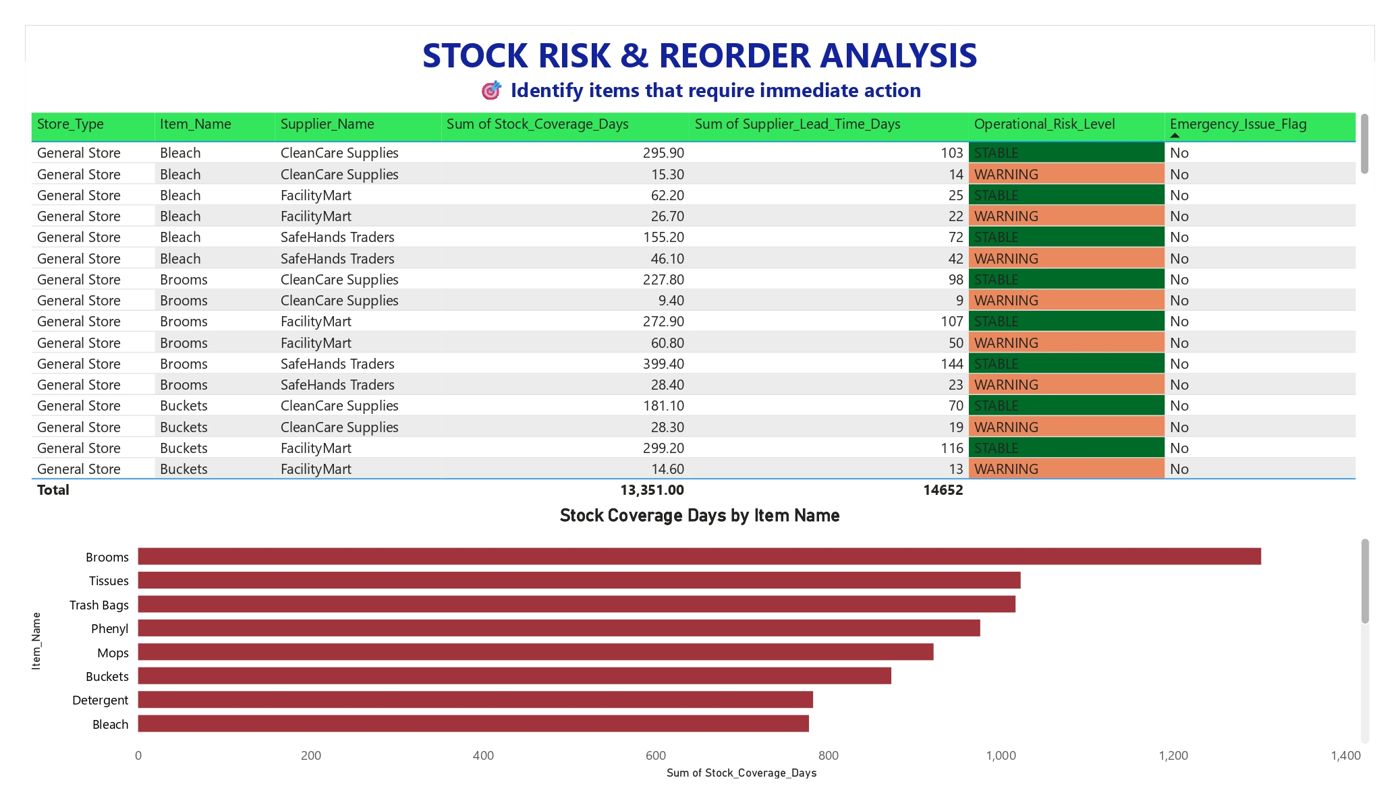
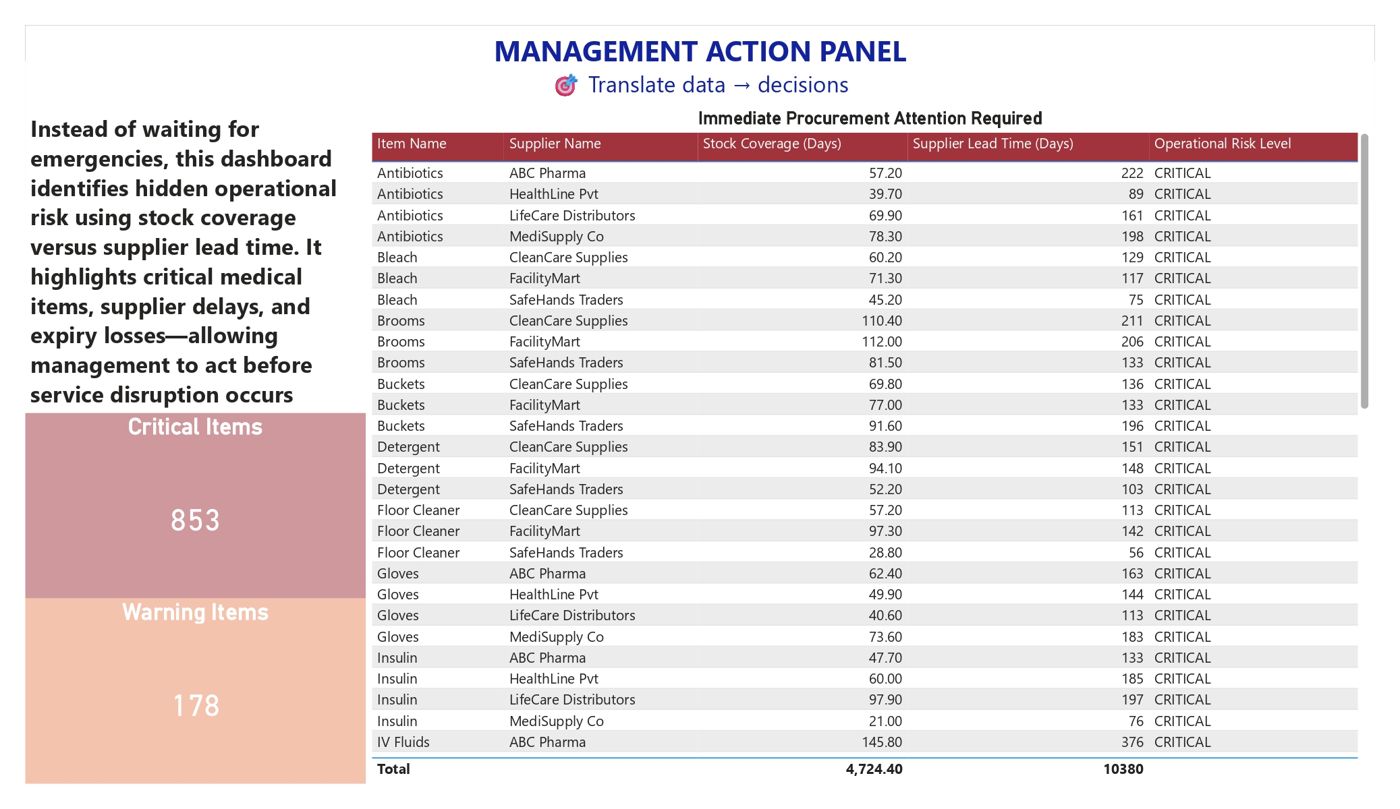
Stock coverage set against supplier lead time, with expiry losses by item, so critical shortages show up before a ward runs out.
Capacity, waits and patient flow
Bed occupancy, doctor and nurse load, ER waiting times and SLA breaches by department, to guide staffing and bottleneck fixes.
Readmissions and data quality
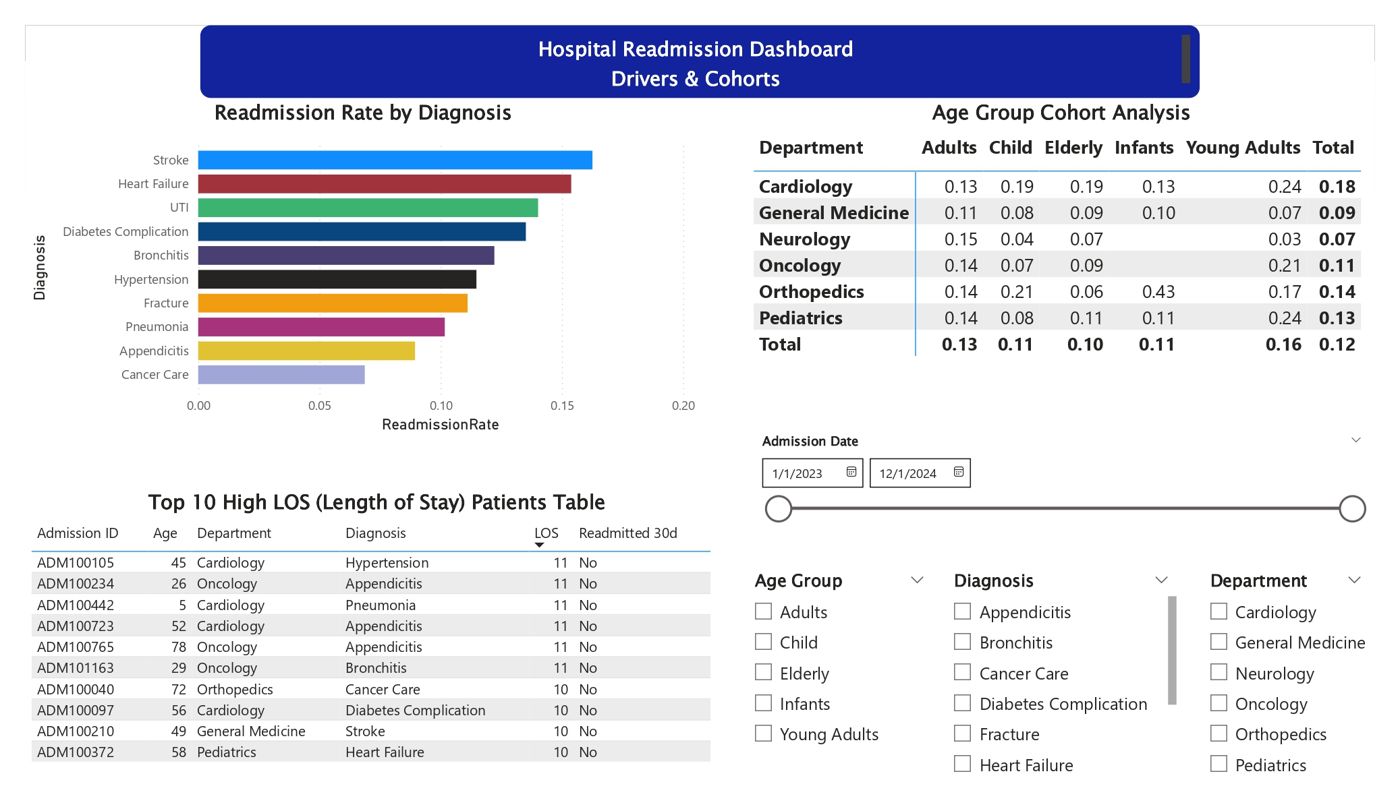
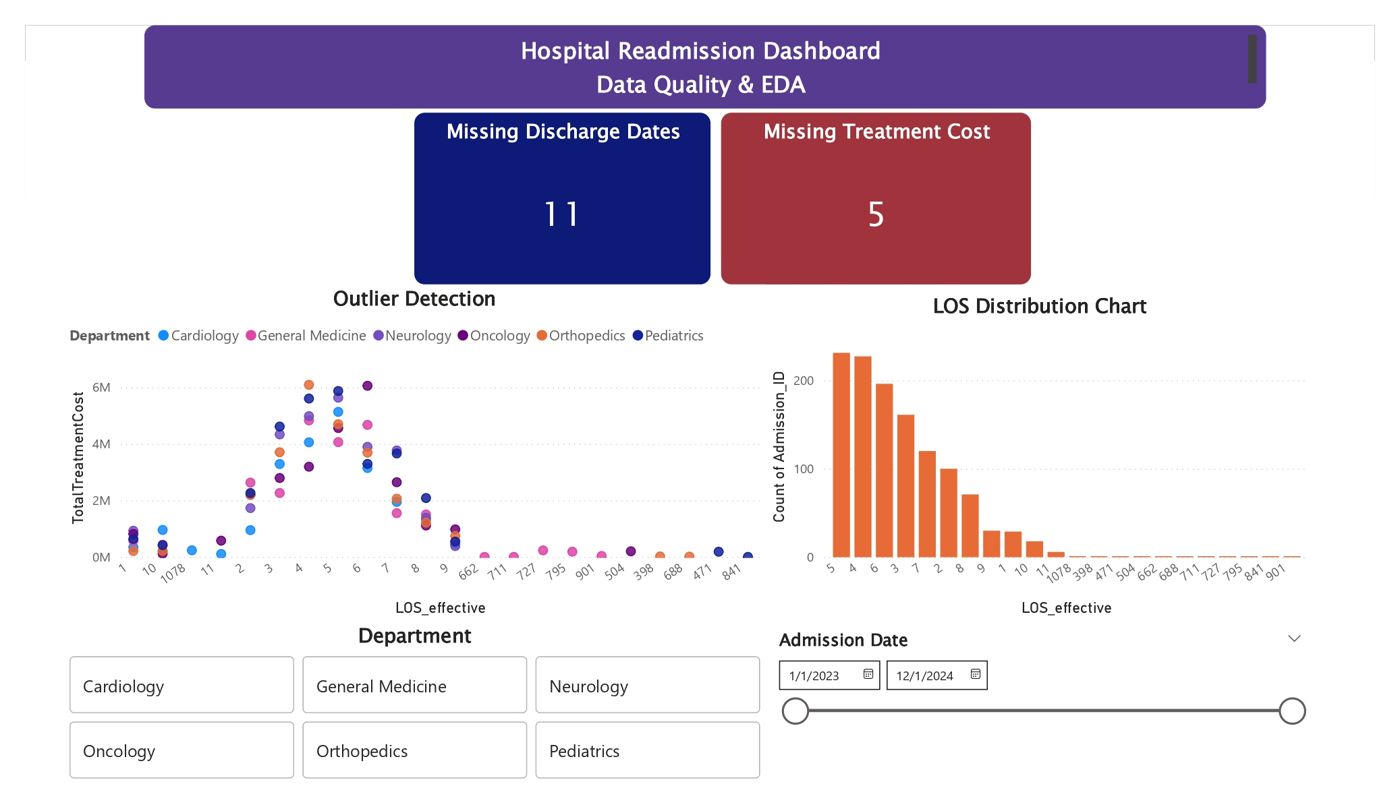
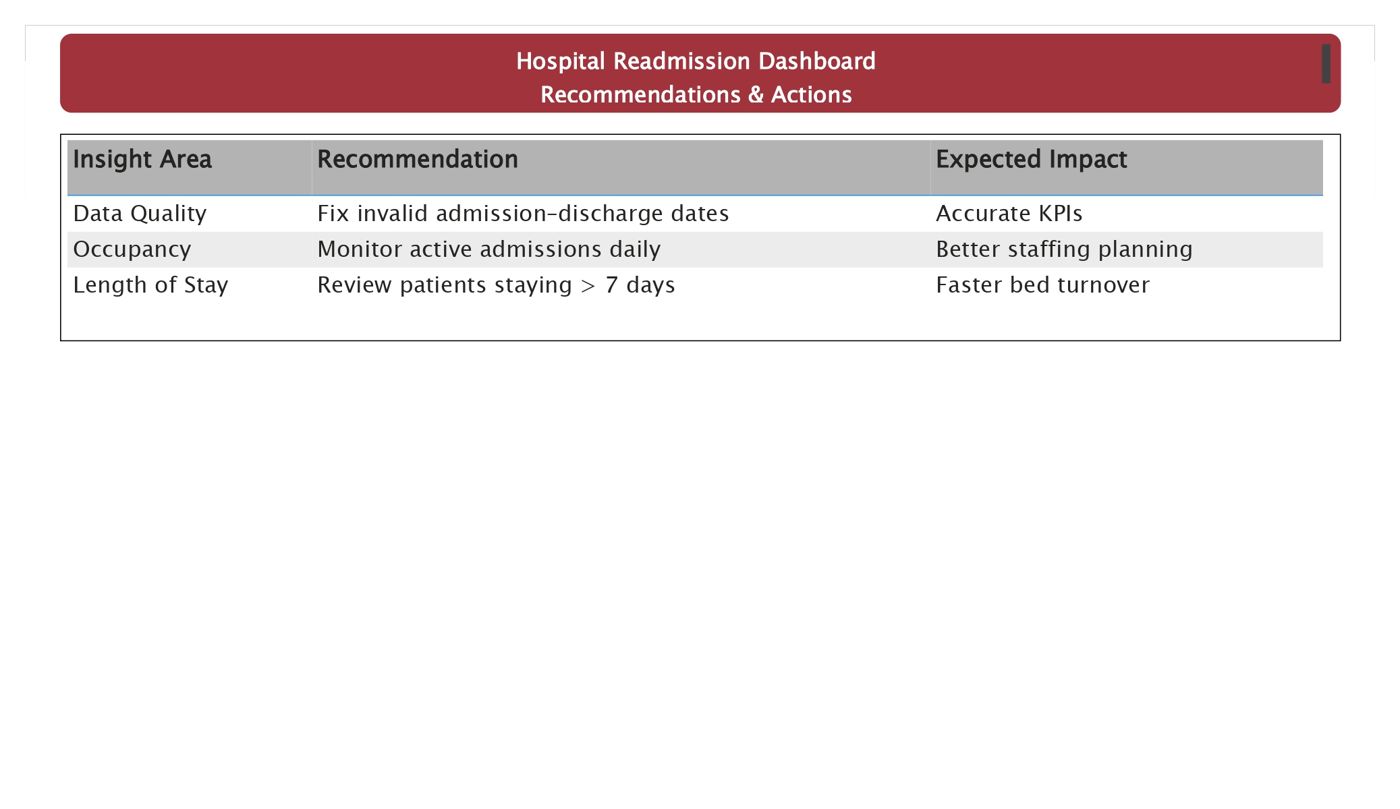
Readmission drivers by diagnosis and age group, plus checks for missing and invalid records, so leadership can trust the numbers.
Sample projects
Five Power BI projects built on simulated hospital data. No patient information appears in any of them. Select a thumbnail to open any report page.
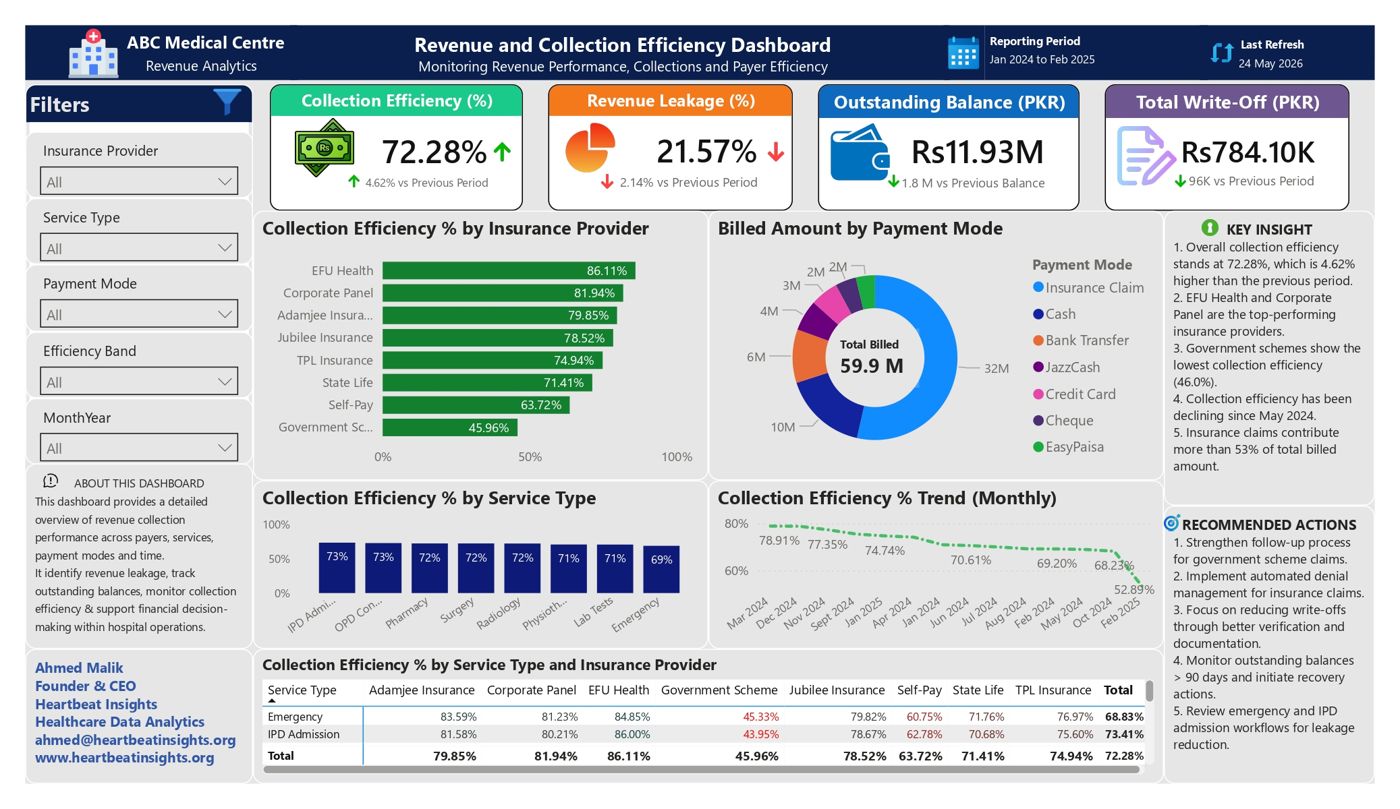
Revenue and collection efficiency
Which payers and services are slowing down cash collection?
- 72.28% collection efficiency, with 21.57% revenue leakage
- Government schemes collect just 45.96%, against 86.11% for the best private insurer
- Rs11.93M still outstanding, with collection efficiency falling since May 2024
Hospital operations suite
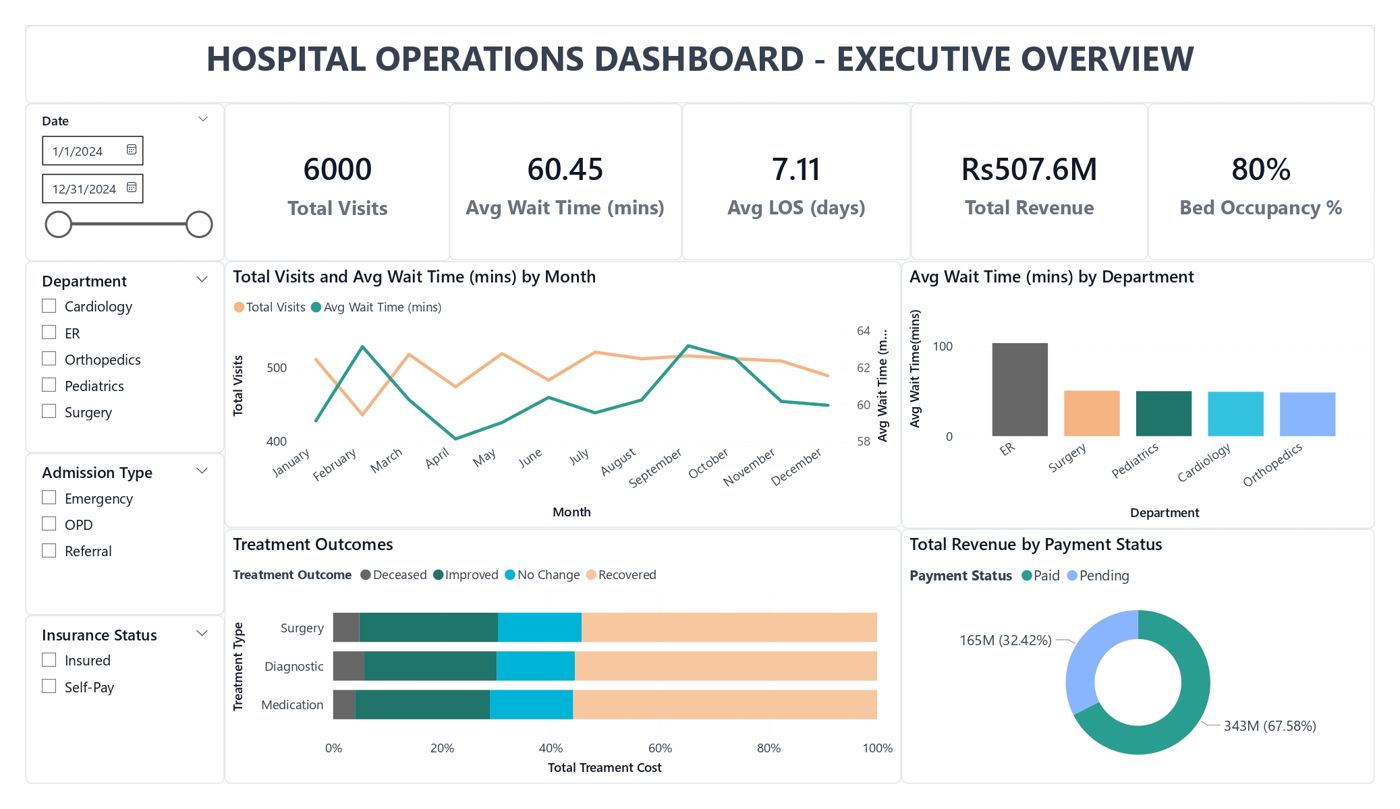
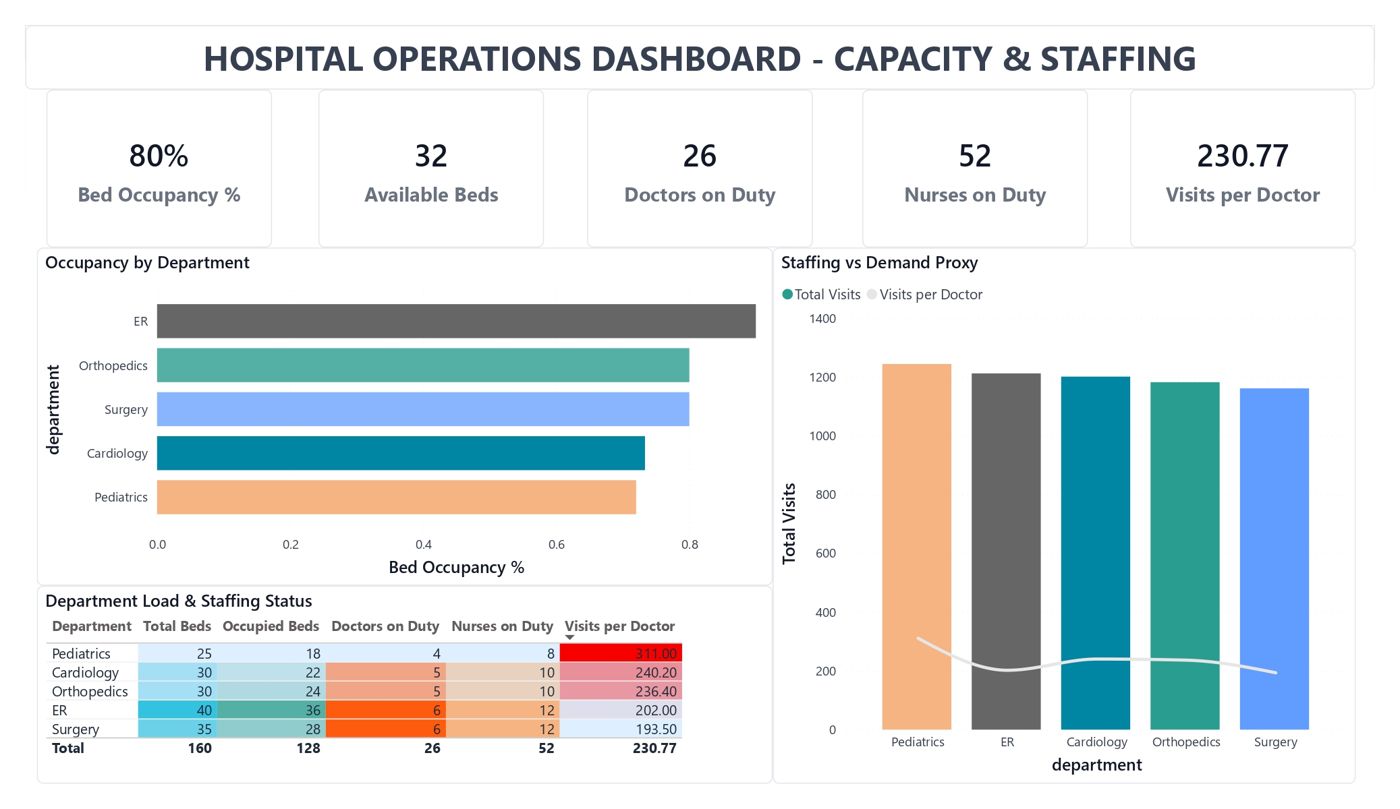
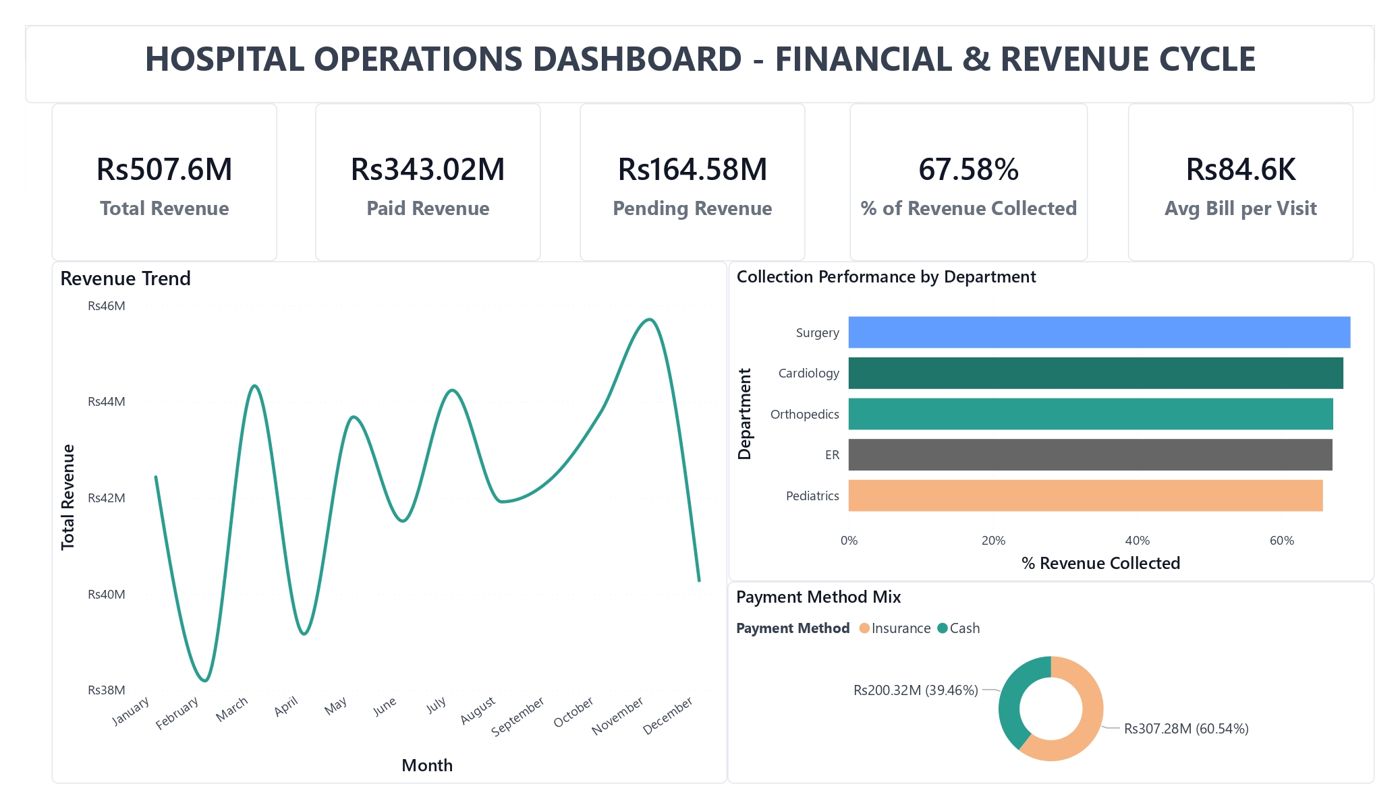
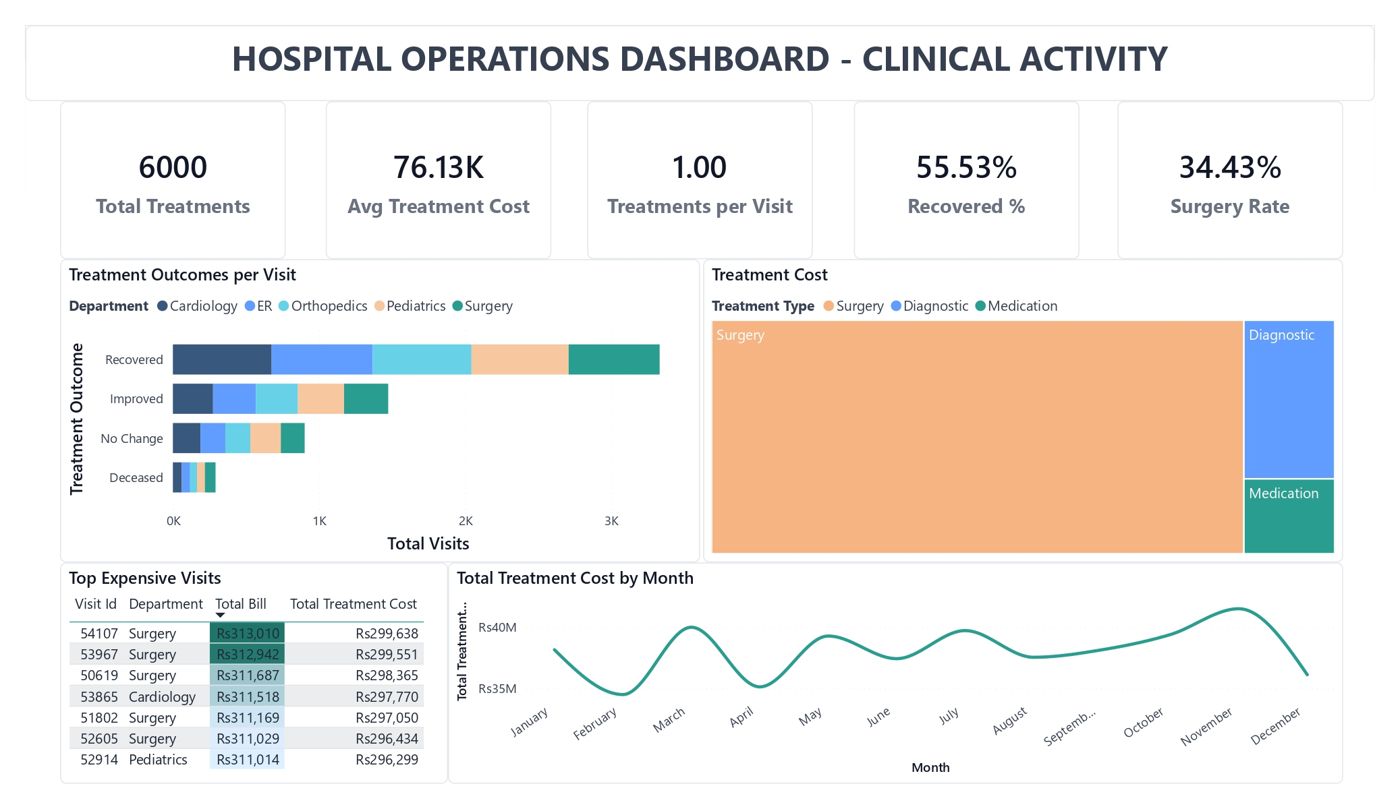
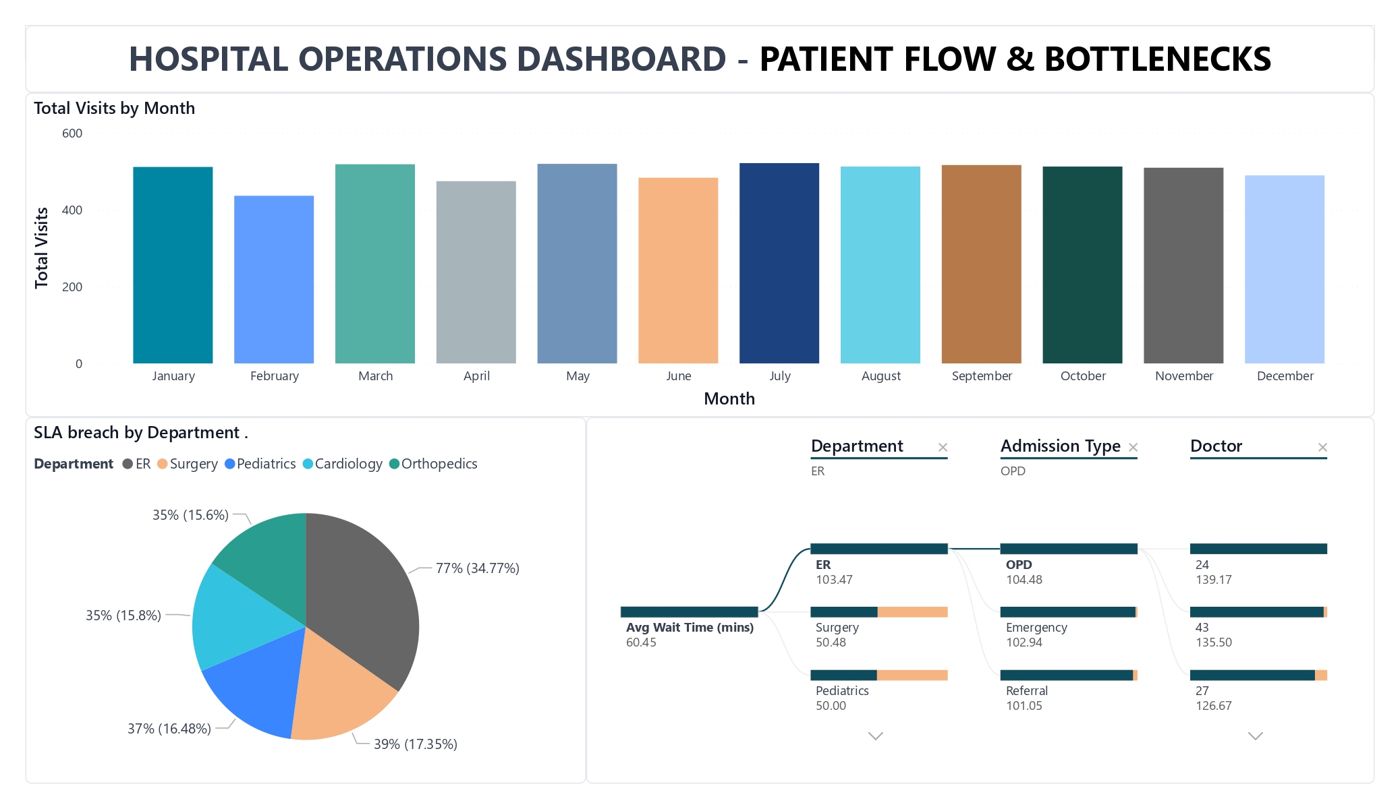
Where do waits, staffing and revenue break down across 6,000 visits? Five report pages cover it.
- ER waits average 103 minutes, about double Surgery and Pediatrics at 50
- Pediatrics carries 311 visits per doctor, against 193 in Surgery
- Rs164.58M of Rs507.6M revenue is still pending, or 32%
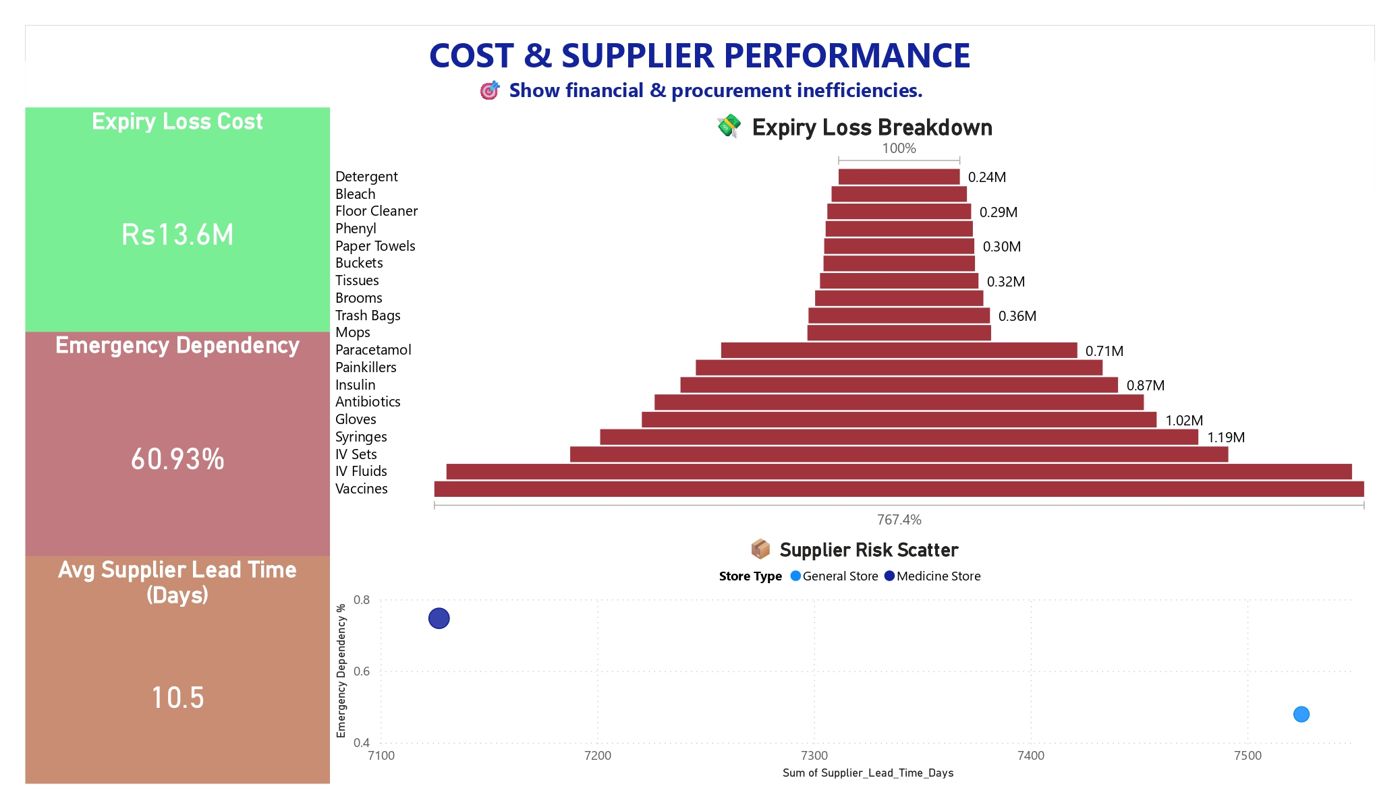
Inventory and expiry risk
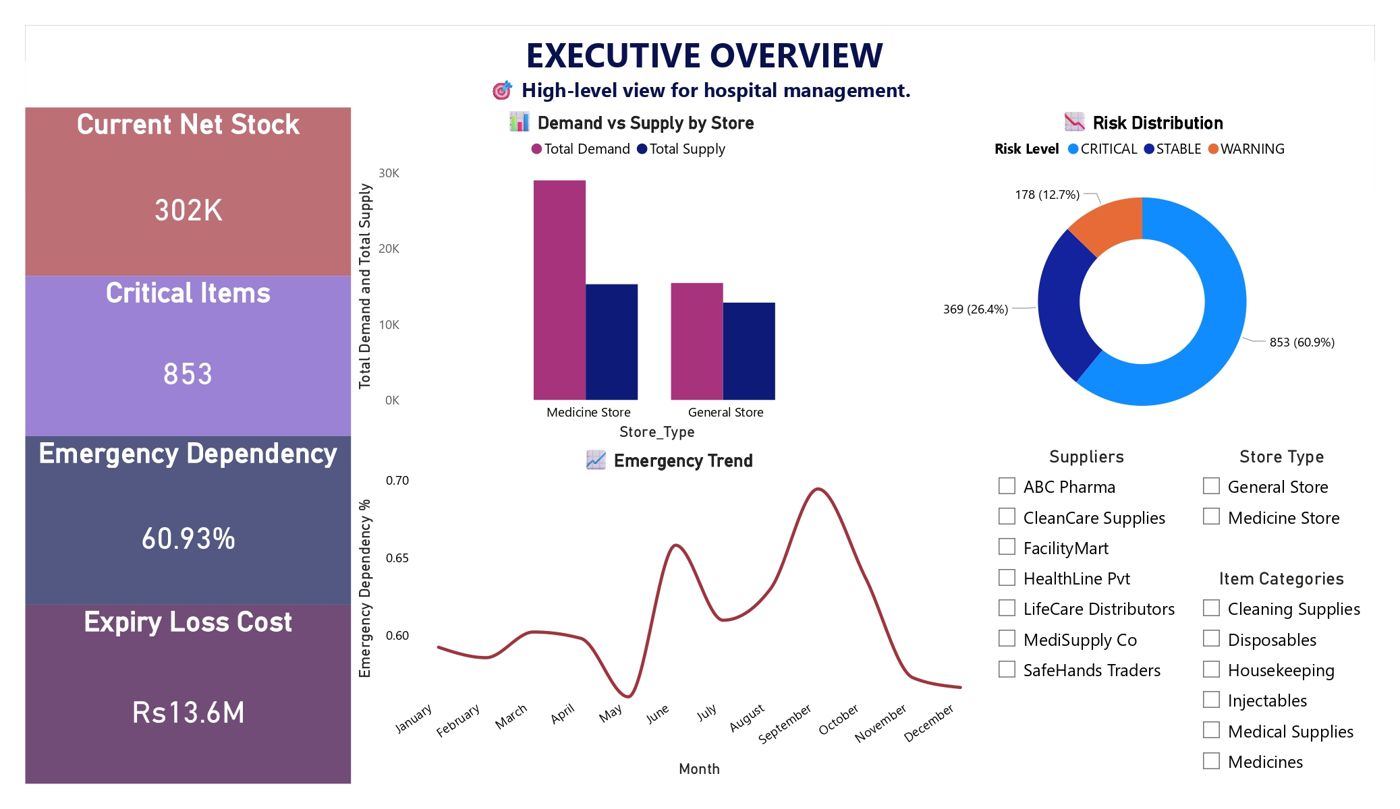
Which items will run out before the supplier can deliver?
- 853 items flagged critical, 61% of those tracked
- Rs13.6M lost to expiry, led by vaccines and IV fluids
- 60.93% emergency dependency across the general and medicine stores
Admissions, billing and data quality
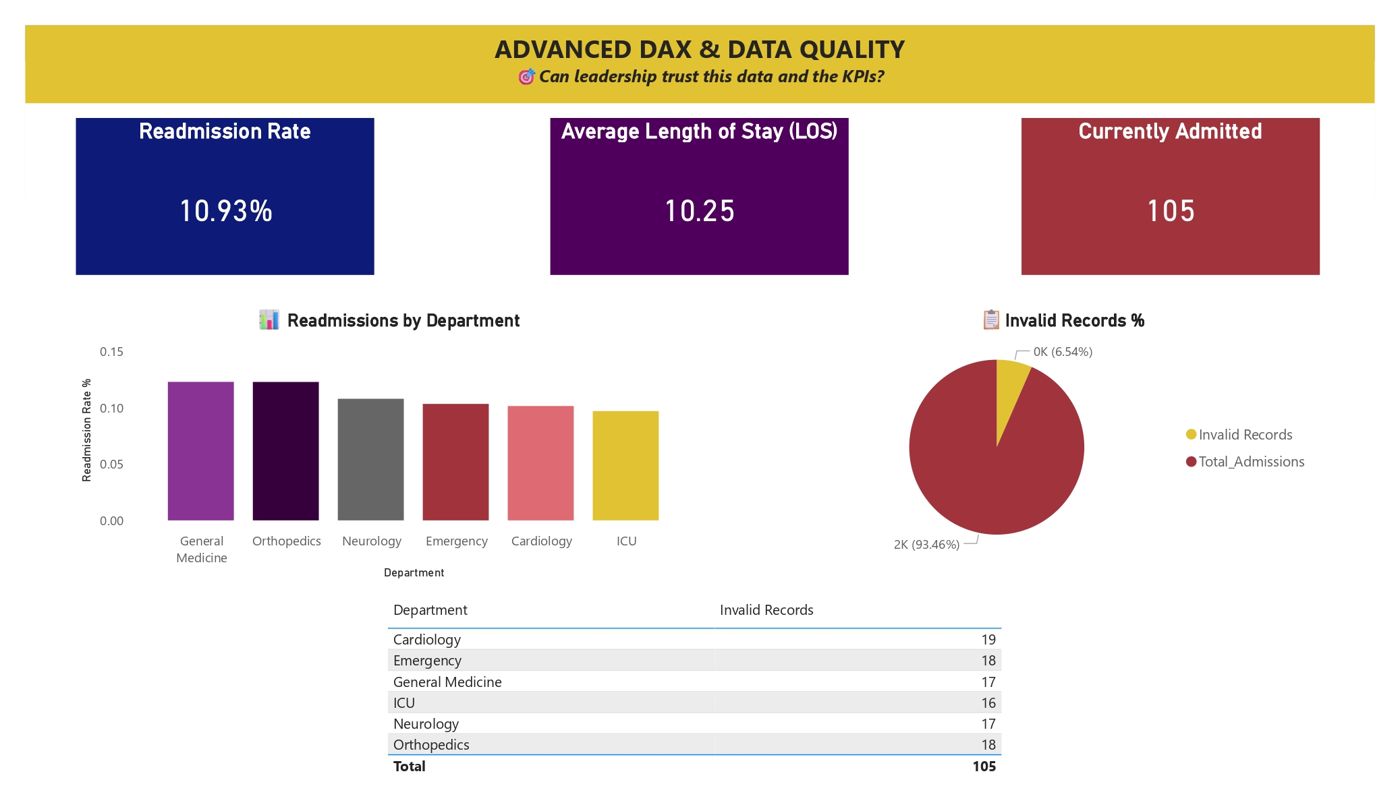
Can leadership trust these KPIs?
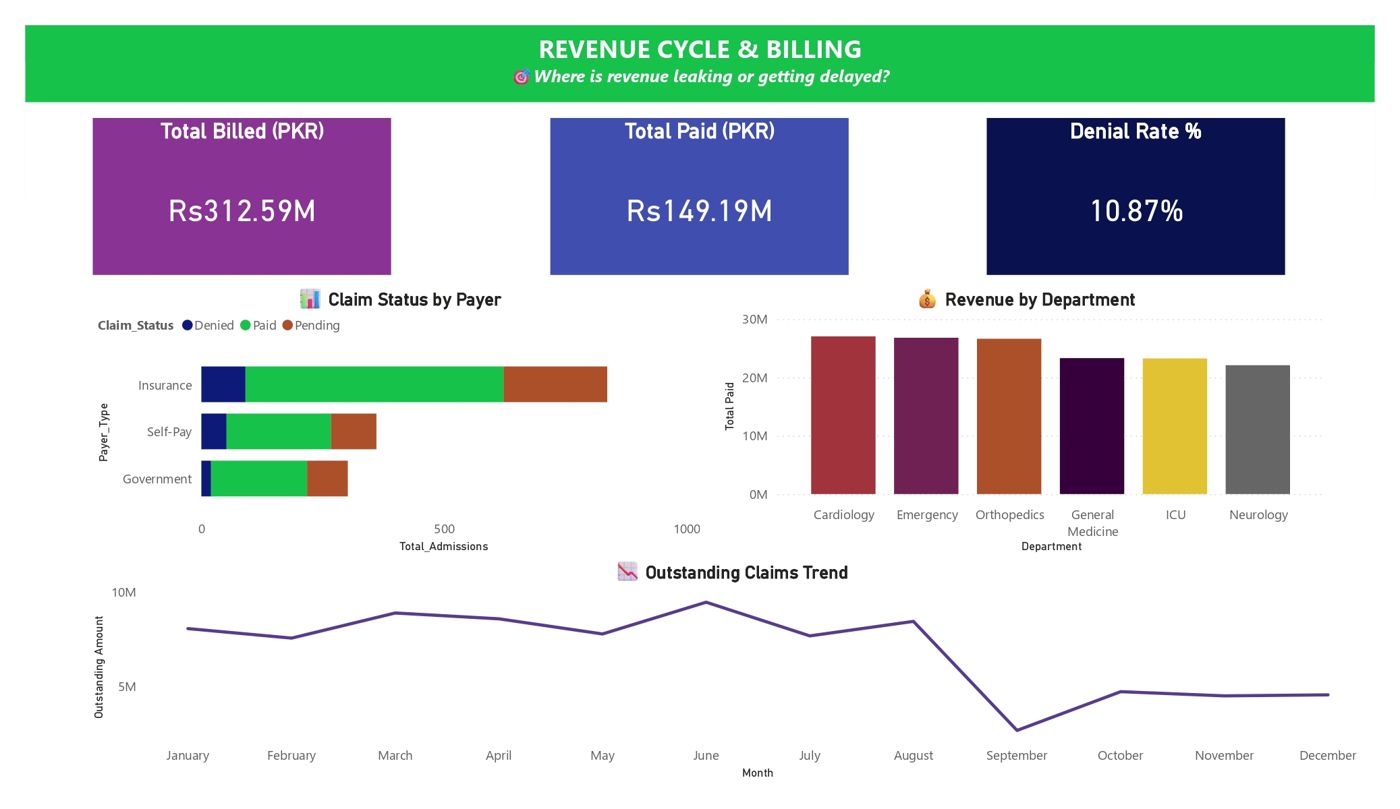
- Rs149.19M paid against Rs312.59M billed, with a 10.87% denial rate
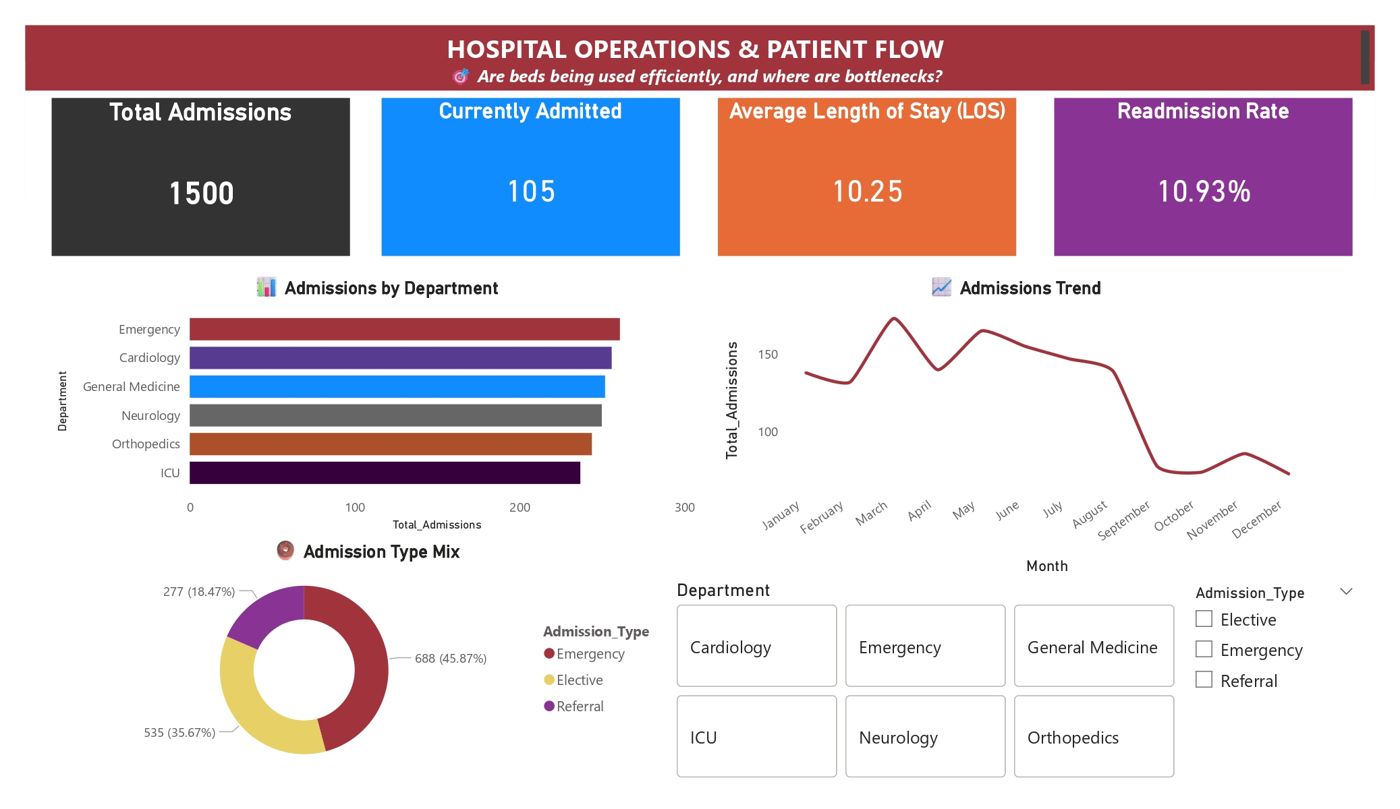
- 10.93% readmission rate and a 10.25-day average stay across 1,500 admissions
- 6.54% of records flagged as invalid, broken down by department
Readmission analysis
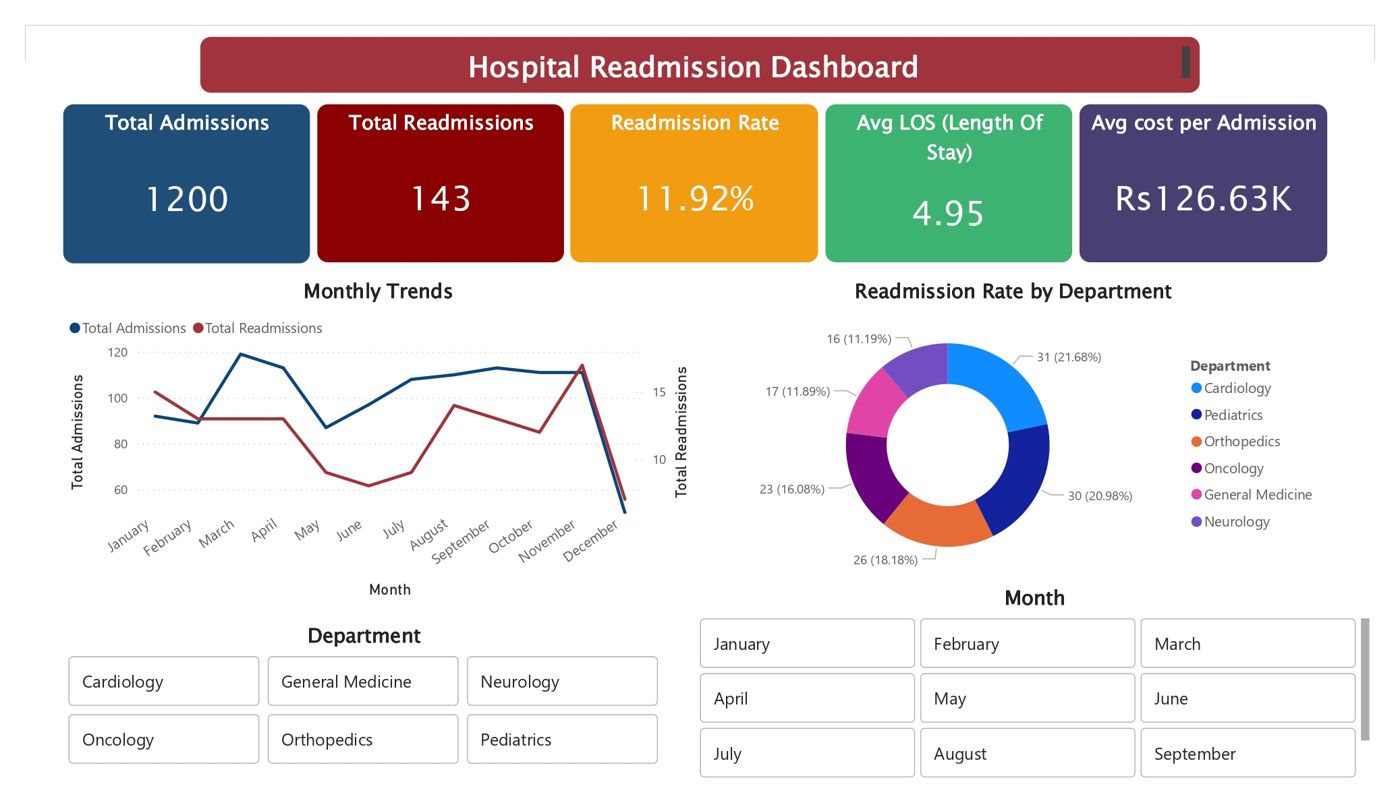
Which patients come back, and what does it cost?
- 143 readmissions from 1,200 admissions, a rate of 11.92%
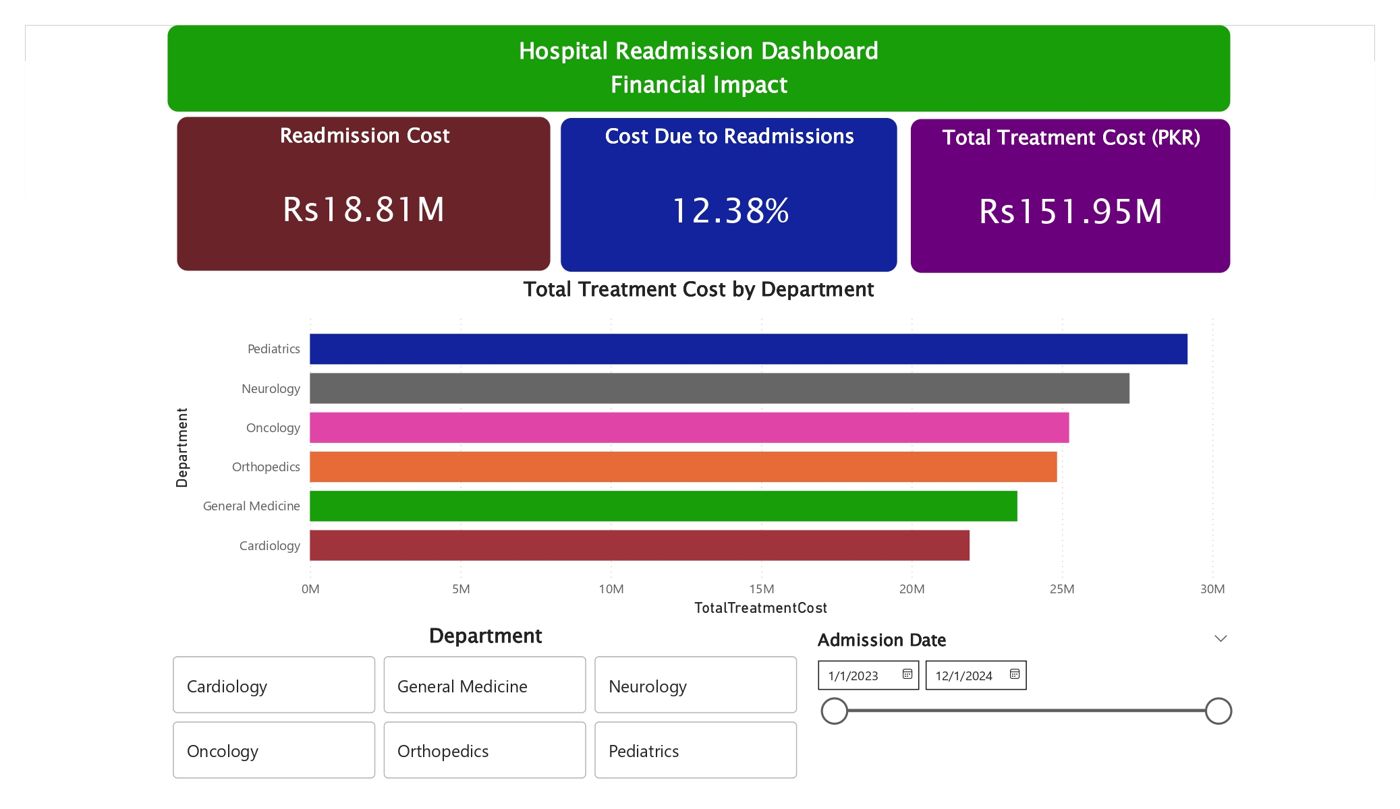
- Readmissions account for Rs18.81M, or 12.38% of treatment cost
- Stroke and heart failure have the highest readmission rates by diagnosis
How a project runs
Scoping call
Twenty minutes on the reports you struggle to get and the data you already export.
Data handover
De-identified or aggregated exports only. I sign an NDA before receiving anything sensitive.
Starter report
A fixed-fee revenue leakage report or one focused dashboard, agreed before work begins.
Walkthrough
I present the findings to your team and explain every figure.
Why a hospital administrator?
I moved into data analytics after more than 12 years on the operations side of hospitals. I know why collections lag, why stock runs short and which numbers a ward manager will actually open.
Power BI, DAX, SQL and Excel are how I turn that into dashboards your team can use.
- 12+ years in hospital administration, stores and support services
- Master's in Environment and Development, University of Manchester
- Bachelor's in Economics
- Data analytics bootcamp, Atomcamp Pakistan
- Power BI, DAX, SQL and Excel
Start with one report
Tell me which numbers you struggle to get today. I will reply with what a starter revenue leakage report would cover and what it costs.